Teaching
I currently supervise tutorials and demonstrate laboratory sessions for first-year physics and second-year astrophysics courses at UNSW Canberra. This page is home to various resources I hope will be useful to students and others.
Physics 1A/B (ZPEM1501/02)
Dimensional analysis
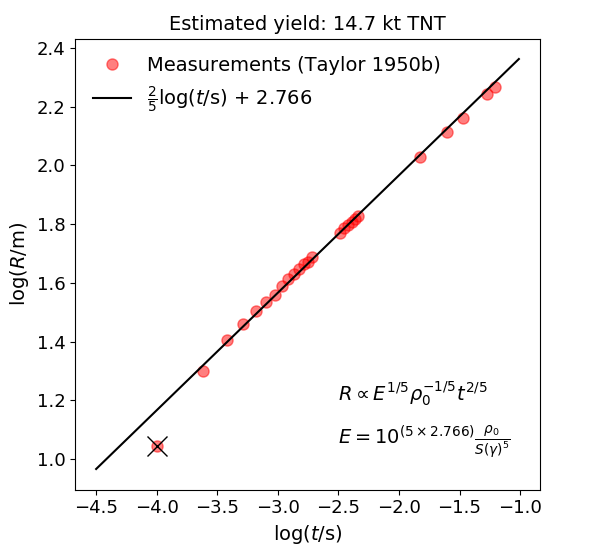
The Trinity nuclear test of July 16, 1945 is often used to teach dimensional analysis, usually purporting to follow the method published by British physicist Sir Geoffrey Taylor in 1950 to find the yield of the bomb. In reality his derivation was more complex, but the example is a good one pedagogically. To demonstrate the utility of dimensional analysis, I have written a short background to the problem and applied the analysis to Taylor's measurements to derive the yield of the test.
Full explanation and derivation (PDF, 6 pages incl. references)
Python script to create plot (requires numpy and matplotlib)
Update Feb 2021: Diaz (2021) have applied Taylor's method to the 4 August 2020 explosion of a large amount of ammonium nitrate in Beirut, Lebanon. My PDF above now includes a brief description of their method and their radius-time plot.
Diffraction gratings
To aid students' understanding of diffraction gratings I created the following simulation of a 300 lines/mm transmission grating dispersing visible wavelengths (click on each image to enlarge):

From such a plot it is easy to see how the dispersive power of the grating increases with order number, with the caveat that higher orders overlap at certain angles. For example, the n = 2 and n = 3 orders partially overlap for this grating, with the 400 nm wavelength at n = 3 coincident with the 600 nm wavelength at n = 2, as expected from the grating equation, n λ = d sin(θ).
A spectrograph observing red wavelengths in the n = 2 order around θ = 0.4 radians would require a blue-blocking filter to avoid contamination by the higher order. Alternatively, a red-blocking filter could be used to observe the n = 3 blue spectrum at higher dispersion.
Astrophysics (ZPEM2509)
As students were unable to use computer labs in 2020 due to the pandemic, I created two astrophysics lab exercises on eclipsing binaries and the Sun for second-year students to complete on their own devices using free, multi-platform software. I hope to expand on these in future once students are back in the lab. In particular, taking advantage of Jupyter notebooks to guide students with limited or no programming experience through 'research-grade' astronomical investigations using Python.
Eclipsing binary lab
Pre-lab reading (PDF) - general introduction to binary stars and in particular eclipsing binaries.
To complete the pre-lab activities you'll also need to use the eclipsing binary simulator created by the NAAP project at the University of Nebraska-Lincoln:
NAAP Labs software - install then run the "Eclipsing Binary Stars" lab
Once you've completed the pre-lab activities you can download the Jupyter (Python) notebook and all data files for the lab from my Github repository and run it on your machine.
Or, preferably, you can run the notebook in your browser using the Binder platform:
![]()
Note: It may take a few moments to initialise the notebook. For more information on running Jupyter notebooks containing Python code, see here or here.
Copies of the data files are available in the Github repository, or download them here:
TESS light curve
SkyMapper light curve
WiFeS radial velocity measurements
Update Sept 2020: Extra for experts! Use the masses and radii calculated in the lab to estimate the ages of the stars by comparing them to Baraffe et al. (2015) model isochrones:
![]()
Update Oct 2020: The following video from the UNL Astronomy Department shows a nice way to visualise an eclipsing binary system using dimmable light bulbs on a turntable!
Sun lab
Pre-lab reading (PDF) - general introduction to the Sun and the SOHO spacecraft.
Part I - Limb darkening
This ZIP file (1.4 Mb) contains 6 images of the Sun taken by several observatories and spacecraft at different wavelengths. Use these images in Part I of the lab script with the ImageJ software to measure the limb darkening profile of the solar disc and analyse the appearance of physical features (e.g. sun spots, flares, phages) at different wavelengths.
Part II - Solar rotation
This ZIP file (9 Mb) contains 30 daily 'intensitygram' images of the Sun taken by the MDI (Michelson Doppler Imager) instrument on the Solar and Heliospheric Observatory (SOHO) spacecraft between 2001 October 23 and November 21. The intensitygrams are approximately white-light images of the solar surface where cooler sun spots appear as darker regions.
Use these images in Part II of the lab script to trace the motion of sun spots over the solar disc with time and determine the Sun's sideral rotation rate.
Image credit: SOHO/MDI consortium, NASA/ESA. Animation created using http://gifmaker.me
Part III - Motion of a Coronal Mass Ejection (CME)
This ZIP file (3 Mb) contains 6 images of a CME moving away from the Sun, as observed by the LASCO (Large Angle and Spectrometric COronagraph) instrument on SOHO over several hours during 1999 August 5 and 6. A coronagraph is a special telescope designed to block light coming from the solar disc, in order to see the extremely faint emission from the region around the Sun, called the corona.
Use these images in Part III of the lab script to trace the motion of the CME with time and calculate its velocity and acceleration. How does this compare to the solar surface escape speed?
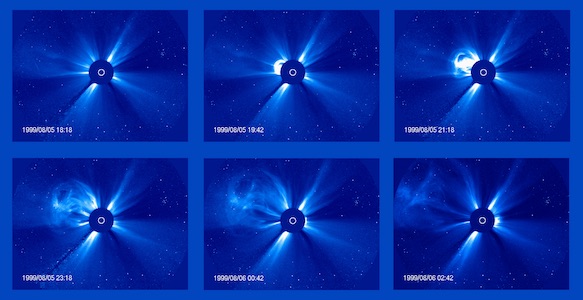
Image credit: SOHO/LASCO consortium, NASA/ESA.
Background image credit: Akira Fujii.
I acknowledge that I live and work on the land of the Ngunnawal people, and pay my respects to their Elders, both past and present.